Pharmacy Division Ramathibodi Hospital

Home
Pharmacist
About
รอบรู้เรื่องยา
คุยกันเรื่องยา


News 24/03/2544


EXTENDED-RELEASE NIACIN SAFE FOR DIABETICS WITH UNCONTROLLED HYPERCHOLESTEROLEMIA
Diabetics with poorly controlled cholesterol levels despite statin therapy can be safely given extended-release niacin

LONG-TERM USE OF ERT INCREASES RISK OF OVARIAN CANCER DEATH IN US
Postmenopausal women who use estrogen replacement therapy (ERT) for 10 years or more have double the risk of death from ovarian cancer compared with women who have never used ERT, according to a report in the March 21st issue of The Journal of the American Medical Association.

STRATEGIC MANAGEMENT OF PHARMACEUTICAL EXPENSES
Find out how one medical center approaches the challenge of managing pharmaceutical expenses while ensuring appropriate care.
Am J Health-Syst Pharm 58(05):406-409, 2001

INTERRELATIONSHIPS AMONG MORTALITY RATES, DRUG COSTS, TOTAL COST OF CARE, AND LENGTH OF STAY IN UNITED STATES HOSPITALS: SUMMARY AND RECOMMENDATIONS FOR CLINICAL PHARMACY SERVICES AND STAFFING
Increasing clinical pharmacist staffing levels may help reduce mortality rates, drug costs, and length of stay in hospitals.
Pharmacotherapy 21(2):129-141, 2001


Extended-Release Niacin Safe for Diabetics With Uncontrolled Hypercholesterolemia


ORLANDO, FL (Reuters Health) Mar 20 - Diabetics with poorly controlled cholesterol levels despite statin therapy can be safely given extended-release niacin. The combination significantly improves the lipid profile without adversely affecting glycemic control, Texas researchers reported here Monday during the 50th Annual Scientific Session of the American College of Cardiology.

In the past, niacin has been shown to worsen glycemic control in diabetics, Dr. Gloria L. Vega of the University of Texas Southwestern Medical Center in Dallas said, even though niacin corrects the lipid abnormalities typically seen in diabetes.

In her presentation to conference attendees, Dr. Vega described how she and her colleagues tested extended-release niacin (Niaspan, Kos Pharmaceuticals, Miami) in 148 diabetics with abnormal lipid profiles, many on statin therapy, in a 16-week trial. The researchers compared the effects of 1 gm and 1.5 gm extended-release niacin with placebo.

Dr. Vega reported that 1 gm extended-release niacin increased high-density lipoprotein cholesterol levels 19% and 1.5 gm increased them 24%, while placebo had no significant effect. Levels of low-density lipoprotein cholesterol did not change significantly with either placebo or 1 gm niacin, while they dropped 8% with the 1.5 gm dose. Triglyceride levels dropped 24% and 29% for patients on 1 gm and 1.5 gm extended-release niacin, respectively.

Fasting blood glucose and hemoglobin A1c levels did not change during the study in the placebo and 1 gm arms of the study, but patients on 1.5 gm niacin had a worsening of glycemic control.

"We are very excited about this study," Dr. Vega told Reuters Health. "Extended-release niacin can be incorporated into the treatment regimen of diabetics....It can be used with statin therapy or triglyceride-lowering drugs....There was no increase in liver enzymes and no increased weakness" during the study period, she added.

"Certainly you are not going to take a patient with poor glycemic control and try this," Dr. Vega said. "But most physicians are not aware that niacin can effectively increase HDL....Niacin has a bad reputation in terms of glycemic control, but you can control that with drugs rather than discontinue the niacin," she asserted.


Long-Term Use of ERT Increases Risk of Ovarian Cancer Death in US


WESTPORT, CT (Reuters Health) Mar 21 - Postmenopausal women who use estrogen replacement therapy (ERT) for 10 years or more have double the risk of death from ovarian cancer compared with women who have never used ERT, according to a report in the March 21st issue of The Journal of the American Medical Association.

Using data from the American Cancer Society's Cancer Prevention Study II, Dr. Carmen Rodriguez and colleagues from the American Cancer Society, in Atlanta, studied overall ovarian cancer mortality among 211,581 postmenopausal women. The women were classified at baseline as estrogen users, never users or former users and by the number of years they used ERT.

During the followup period from 1982 to 1996, a total of 944 women in the cohort died from ovarian cancer. Compared with women who never used ERT, those who did had significantly higher rates of death from ovarian cancer (risk ratio 1.51), the researchers report. Among former users of ERT the risk was slightly but not significantly increased (risk ratio 1.16).

The number of years that a woman used ERT increased the risk of death from ovarian cancer for both users at baseline and former users. Women who reported at baseline that they had been using ERT for 10 years or more had a risk ratio of 2.20 compared with never users, and former users who had used ERT for 10 years or more had a risk ratio of 1.59, Dr. Rodriguez's group found.

"Annual age-adjusted ovarian cancer deaths rates per 100,000 women were 64.4 for baseline users with 10 or more years of use, 38.3 for former users with 10 or more years of use, and 26.4 for never users," the researchers report.

Among former users with 10 or more years of use, as time from the last use of ERT increased, mortality risk decreased. The risk ratio was 2.05 among women who had last used ERT less than 15 years before baseline, and it was 1.31 among those who had last used it 15 years or more previously.

"Before we can make definitive recommendations to women, based upon this data, we have to get results from the Women's Health Initiative trial to see if ERT increases the risk of coronary heart disease, and we also need to know the effects of combination hormone replacement therapy," Dr. Rodriguez told Reuters Health.

"Even then, because there are both risks and benefits, a woman still will have to make her own decision about ERT," she added.

JAMA 2001;285:1460-1465.


Strategic Management of Pharmaceutical Expenses


Rita Shane
[Am J Health-Syst Pharm 58(05):406-409, 2001. ? 2001 ASHP, Inc.]


Problem

The rapid release of new drugs, expanded indications for existing therapies, and increased annual expenditures for pharmaceutical products represent a formidable challenge to pharmacy managers. A strategic approach to managing pharmaceutical expenses is critical to fulfilling organizational financial objectives, gaining support from the medical staff to ensure appropriate drug use, and maintaining the viability of the pharmacy department.

Background


Our medical center is a 1000-bed acute tertiary care teaching institution with approximately 200 house-staff physicians and 2000 private attending physicians. We deal with a number of payers with various contractual arrangements. Although there has been significant managed care penetration in our geographic area, capitation is only one method of reimbursement, and many payers are moving away from capitation because of losses. Our other contracts include per diem rates, discounted fee-for-service arrangements, and case rates.

Analysis and Resolution


Our multifaceted approach includes prospective strategies, education of decision-makers, employment of medical staff task forces, attention to disease- or procedure-specific treatment, and retrospective analysis.

Prospective Strategies

We utilize a number of prospective strategies with the goal of integrating the clinical and financial management of pharmaceuticals. It is essential to monitor not only the clinical literature but also the health care literature to keep abreast of changes in reimbursement. We maintain ongoing communication with our contracting personnel to keep them informed about anticipated approvals of expensive new therapies. This facilitates a prospective approach to negotiating with payers. Reduced reimbursement of health care organizations as a result of the Balanced Budget Act of 1997 (BBA) continues to be a challenge. Areas most affected are transitional care units (skilled-nursing facilities) and prospective-pricing-exempt units, such as psychiatry, rehabilitation, and outpatient services.[1] Since reimbursement is being substantially reduced in these areas, effective resource management is essential.
The Outpatient Prospective Payment System, which was created under the BBA, was implemented in August 2000. Payments are based on the Ambulatory Payment Classification (APC) system, which consists of 451 groups of outpatient services. Many medications are reimbursed via a bundled payment. Exceptions include antineoplastic agents, new drugs, and biologicals that were not paid for by the Health Care Financing Administration before 1997 and whose cost is "not insignificant."[2] For new agents, payment will be determined by a specific formula and based on "a determination that must be made that these items are reasonable and necessary for the diagnosis or treatment of an illness or injury or to improve the functioning of a malformed body member as required by section 1862(a)(1)(A) of the Act." Knowledge of the changes in reimbursement under the APC system is especially important in evaluating the impact of new drugs utilized in out-patient settings. Participation in the business planning process, especially for programs such as bone marrow and solid organ transplantation, ensures that pharmaceutical expenses and additional staffing requirements are considered as the programs are implemented and that the pharmacy is not left in the position of having to independently justify increases in expenses that result from these programs. An evaluation of proposed medication regimens also provides an opportunity to develop guidelines for drug use and recommendations. Such guidelines can reduce program expenses by encouraging the use of medications that are equally effective but less expensive than those originally considered. For example, during the planning of programs for rapid opiate detoxification, we reduced expenses by showing that some medications in a proposed regimen were not essential.

Participation in business planning ensures that the projected profit/loss for the program includes pharmaceutical and staffing expenses. Additionally, expense projections are critical to the contracting department in negotiating reimbursement rates with payers, especially if case rates are being established.

Even when pharmacy's participation in business planning is routine, new programs can be initiated without regard to pharmaceutical expenditures. One recent example involved a new wound care program that had already been approved. The pharmacy department was invited to participate during the implementation stage after the business plan had already been approved. We learned that the patients in this program would be using becaplermin, a new topical growth factor indicated for diabetic lower-limb and foot ulcers. The cost of becaplermin is $312 per tube, and the duration of treatment is 8-20 weeks. We recognized the need to educate the program administrators about the cost of this medication and the course of treatment. We also recognized that, since this was an outpatient therapy, an evaluation was needed to determine if payers would cover the medication. Our survey of 13 payers revealed that 5 would cover the therapy, but the copayment was as high as $70 per tube. We explained that the program could result in patient dissatisfaction unless expectations and treatment options were discussed at the outset.

Educating Decision-Makers


Educating decision-makers about drug costs is important at a time when costs of over $1000 per dose or course of drug therapy are not unusual. A report issued in July 1999 by the National Institute for Healthcare Management, Research, and Educational Foundation demonstrated the percent contribution of increases in prices and utilization on pharmaceutical expenditures in the retail sector from 1993 to 1998. [3] The report indicated that 64% of the increase in pharmaceutical expenditures during this period was due to the pricing effect, with 42% of the increase attributable to the high prices for new drugs and 22% to higher prices for older drugs. Higher utilization was responsible for the remaining 36% of the total increase. This information has been shared with our administrators to ensure that they understand that high prices of both old and new pharmaceuticals play a significant role in increasing expenses.
Benchmarking is another strategy that can be used in the educational process. We participate in a survey that annually evaluates demographic, staffing, and financial indicators for 45 hospitals.[4] The survey includes indicators such as pharmacists per 100 beds, total staffing per 100 beds, and drug costs per case. We evaluate our data in comparison with 20 hospitals in the survey group that have an average number of 560 beds, and we share the information with administration.

We prepare an annual forecasting document as part of the budgetary process to document the fiscal impact of new drugs we anticipate being approved and existing drugs that have expanded indications based on new studies. Although we are not always successful in having the total forecasted expenses approved, the information serves to educate decision-makers about the cost of treating the populations we serve.

A historical evaluation of our actual expenditures versus the forecasted budget is provided to administration annually. Our organization has had a 22% increase in patient days over the past 3.5 years. Therefore, we have been tracking drug cost per patient day, since total drug costs do not indicate whether the increase in our drug expenditures is due to patient days or to expensive new therapies.

The overall trend has been favorable, except for the previous fiscal year, when the cost per patient day increased from the prior year's $69.96 to $72.11. In reviewing drug expenditures, we determined that the shortage of intravenous immune globulin (IVIG) had greatly increased our expenditures, since we had had to pay up to $140 per gram. Purchasing IVIG during the shortage cost an extra $572,564 in 1999. Expenditures for cytomegalovirus immune globulin also increased, since this agent was used when IVIG was unavailable. This represented an additional $88,000 compared with the previous year. Infliximab became available in late 1998, and our organization had conducted the pivotal study for approval of this agent. Expenditures for infliximab were $366,000 during the 1999 fiscal year. In total, the expenses for these three agents represented approximately $1 million, or $4.02 per patient day. When we subtracted this amount from the drug cost per patient day of $72.11, the adjusted amount, $68.09 per patient day, demonstrated to administration that our resource management strategies appeared effective in controlling the rate of increase in expenditures.

Task Forces


One of our key strategies is working with the medical staff. We convene a group of physician experts before the release of an innovative medication or class of medications that we anticipate will have a significant impact on our budget. The goal of these task forces is to obtain physician input on the role of these medications and to develop guidelines by using an evidence-based approach. When we convene a task force, we are honest in acknowledging that the high cost of the medication is one of the main reasons why we need help developing guidelines on its use. We state that, while there is evidence that demonstrates efficacy in limited indications, we also recognize that there is a potential for over-utilization, which is something we cannot afford in the current environment unless we are going to cut other programs and services. We then ask the physicians if they would be willing to help us by prospectively evaluating uses that fall outside the guidelines to determine when the uses are appropriate. The physicians who have served on the task force have generally agreed to serve as reviewers. When an order falls outside the guidelines, we can call one of the physician reviewers and ask him or her to speak to the prescriber about the indication and to educate the prescriber about the data in the literature in order to determine whether that drug should be used. We also use specialized order forms whenever possible to facilitate prescribing within the guidelines.
In 1991 we established the first task force and prospective physician reviewer system for colony-stimulating factors.[5] Since then, we have used this approach for a number of therapies, including liposomal amphotericin B formulations, vancomycin, infliximab (in Crohn's disease), fenoldopam, and IVIG. We believe that the prospective physician reviewer system has been successful in reducing the rate of increase in pharmaceutical expenditures. If a reviewer system is not practical, we continue to use medical staff task forces to develop and refine utilization guidelines. We have had task forces for glycoprotein IIb/IIIa inhibitors, antimicrobial selection in pneumonia, erythropoietin, aprotonin, and new therapies for management of rheumatoid arthritis.

We also convene task forces when the literature demonstrates a significant therapeutic advantage with a given therapy or when new information is available that requires a reevaluation of our guidelines. Obtaining input from a group of physician stakeholders facilitates our ability to implement guidelines for expensive therapies. Once the guidelines are established, the pharmacists play a key role in their implementation. They are provided with background information to enable them to target these medications for evaluation. We then periodically conduct medication-use evaluations to determine if the medications are being utilized as outlined in the guidelines. The results of these evaluations are provided to the pharmacy and therapeutics committee, task forces, and other medical staff committees.

The medical staff has also been supportive of initiatives involving our clinical specialists. For example, our oncology pharmacist recently participated in an initiative to delay colony-stimulating factor therapy until day 5 in patients undergoing stem-cell transplantation. Thirty-nine patients were treated with no adverse outcomes and a cost saving of $651 per patient. The pharmacist also developed support for reducing doses of antiemetics by performing an outcomes study to evaluate patient satisfaction and quality of life with conventional versus reduced doses of ondansetron. We received approval to conduct a pilot study with reduced doses of ondansetron for highly and moderately emetogenic therapy and use of a 4-mg dose for rescue therapy. We reduced the cost per patient by 44% from $404 to $226, and quality-of-life scores improved from 24.8 to 16.3 (the worst possible score was 120). The tool used was a modified Functional Life Index for Emesis, which is a validated tool for measuring quality of life in this patient population. Patient satisfaction also improved from 3.6 to 2.2 (the worst possible score was 20). We presented these data to the medical staff, and the physicians were very pleased with the results. The physicians have requested the ability to have the pharmacist manage antiemetic therapy in accordance with a protocol based on the 1999 American Society of Clinical Oncology guidelines, which recommend even lower doses of antiemetic therapy.[6]


Disease- or Procedure-Specific Strategies

We evaluate drug therapies used in the management of a particular disease or procedure to determine opportunities for guideline development. Our organization has a number of clinical teams evaluating the management of specific diseases or conditions to determine opportunities for quality improvement and resource management. The pharmacists participate on these teams and provide recommendations regarding medication use. For example, for the treatment of patients with orthopedic problems, guidelines for surgical prophylaxis, deep-veinthrombosis prophylaxis, and pain management have been developed from evidence in the literature. A number of these guidelines can then be transferred to other surgical procedures.

Retrospective Analysis

A few years ago we started evaluating the institution's experience with expensive new medications and providing feedback to the medical staff and administration about our progress on obtaining reimbursement for these new entities. Although most payers do not specifically reimburse for medications in the inpatient area, the information is still useful as a feed-back tool, especially if there are situations in which the use of a given medication is not clearly beneficial or supported by the literature. Ethically, one would not support withholding critical medications from patients because of reimbursement issues; however, knowledge of reimbursement experience can prompt a reevaluation of the clinical literature and an examination of which patients are candidates for a given therapy and which are not, especially if there are risks associated with its use. Furthermore, the information is important in determining whether a medication needs to be "carved out" when contracts are being renegotiated with payers.

Conclusion


A multifaceted strategy for the management of pharmaceutical expenses helps to control the pharmacy budget while ensuring appropriate care.

References


Balanced Budget Act of 1997: Medicare and Medicaid provisions. www.hcfa.gov/regs/budget97.pdf (accessed 2000 Aug 25).
Prospective payment system for hospital outpatient services (HCFA-1005-FC). www. hcfa.gov/regs/hopps/default.htm (accessed 2000 Aug 25).
Barents Group LLC. Factors affecting the growth of prescription drug expenditures. Washington, DC: National Institute for Health Care Management Research and Educational Foundation; 1999.
The Lazarus report, 1999. Birmingham, AL: Lazarus; 2000 Apr.
Nishimura L, Shane R, Saltiel E. Prospective physician review of orders for colony-stimulating factors. Am J Hosp Pharm. 1992; 49:2722-7.
Gralla RJ, Osoba D, Kris MG et al., for the American Society of Clinical Oncology. Recommendations for the use of antiemetics: evidence- based, clinical practice guidelines. J Clin Oncol. 1999; 17:2971-94.


Rita Shane, PHARM.D., FASHP, is Director, Pharmacy Services, Cedars-Sinai Medical Center, 8700 Beverly Boulevard, A-845, Los Angeles, CA 90048 (shane@cshs.org). Presented at the ASHP Midyear Clinical Meeting, Orlando, FL, December 6, 1999.


Interrelationships among Mortality Rates, Drug Costs, Total Cost of Care, and Length of Stay in United States Hospitals: Summary and Recommendations for Clinical Pharmacy Services and Staffing

C. A. Bond, Pharm.D., FASHP, FCCP, Cynthia L. Raehl, Pharm.D., FASHP, FCCP, Department of Pharmacy Practice, School of Pharmacy, Texas Tech University Health Sciences Center-Amarillo, Amarillo, Texas; and Todd Franke, Ph.D., Department of Biostatistics and Biometrics, School of Public Policy and Social Research, University of California at Los Angeles, Los Angeles, California
[Pharmacotherapy 21(2):129-141, 2001. © 2001 Pharmacotherapy Publications, Inc.]


Abstract

We evaluated interrelationships and associations among mortality rates, drug costs, total cost of care, and length of stay in United States hospitals. Relationships between these variables and the presence of clinical pharmacy services and pharmacy staffing also were explored. A database was constructed from the 1992 American Hospital Association's Abridged Guide to the Health Care Field, the 1992 National Clinical Pharmacy Services database, and 1992 Health Care Finance Administration mortality data. A severity of illness-adjusted multiple regression analysis was employed to determine relationships and associations. Study populations ranged from 934-1029 hospitals (all hospitals for which variables could be matched). The only pharmacy variable associated with positive outcomes with all four health care outcome measures was the number of clinical pharmacists/occupied bed. That figure tended to have the greatest association (slope) with reductions in mortality rate, drug costs, and length of stay. As clinical pharmacist staffing levels increased from the tenth percentile (0.34/100 occupied beds) to the ninetieth percentile (3.23/100 occupied beds), hospital deaths declined from 113/1000 to 64/1000 admissions (43% decline). This resulted in a reduction of 395 deaths/hospital/year when clinical pharmacist staffing went from the tenth to the ninetieth percentile. This translated into a reduction of 1.09 deaths/day/hospital having clinical pharmacy staffing between these staffing levels, or $320 of pharmacist salary cost/death averted. Three hospital pharmacy variables were associated with reduced length of stay in 1024 hospitals: drug protocol management (slope -1.30, p=0.008), pharmacist participation on medical rounds (slope -1.71, p<0.001), and number of clinical pharmacists/occupied bed (slope -26.59, p<0.001). As drug costs/occupied bed/year increased, severity of illness-adjusted mortality rates decreased (slope -38609852, R2 8.2%, p<0.0001). As the total cost of care/occupied bed/year increased, those same mortality rates decreased (slope -5846720642, R2 14.9%, p<0.0001). Seventeen clinical pharmacy services were associated with improvements in the four variables.

Introduction

Numerous studies reported relationships between various components of total cost of care and mortality rates,[1-5] but none evaluated the total cost of care in a large population of United States hospitals. A MEDLINE search could not identify any studies in which the association between drug costs and mortality rates were explored in a large number of hospitals. In addition, no studies evaluated mortality rates, drug costs, total cost of care, and length of stay together in a large number of hospitals. We explored the interrelationships among these variables and summarized relationships between them and the presence of clinical pharmacy services and pharmacy staffing. The association between clinical pharmacy services and pharmacy staffing on length of hospital stay were explored in detail.
Data from 1992 and 1989 showed that pharmacist staffing and certain clinical pharmacy services had a direct relationship and were associated with reduced hospital mortality rates.[6-8] In addition, increased staffing levels of clinical pharmacists and certain clinical pharmacy services had a direct relationship and were associated with reduced drug costs in U.S. hospitals.[9] Finally, increased staff levels of pharmacy administrators and clinical pharmacists and the presence of six clinical pharmacy services had a direct relationship and were associated with reduced total cost of care.[10]
Length of hospital stay provides some measure of the hospital's efficiency. In addition, it is important when analyzing the hospital's profit structure. If two hospitals have the same average daily census, but one of them has a 20% shorter length of stay, that hospital would have 20% more admissions and about the same cost structure. In a capitated reimbursement model, the hospital with 20% more admissions would be able to bill for 20% more patients than the one with longer stay. Our other studies on mortality rates,[6-8] drug costs,[9] and total cost of care[10] did not measure efficiency.
Whereas a substantial number of studies documented the benefits of pharmacists and clinical pharmacy services at individual clinical sites,[11-39] only a few determined the beneficial effects of pharmacists and clinical pharmacy services on major heath care outcome variables in a large number of hospitals.[6-10] Studies of large numbers of hospitals are critical, since they are not subject to bias of patient populations, quality of health care professionals, physical facilities, structure, and process that may confound studies conducted in individual sites. In addition, when analyzed together, multihospital studies provide a road map as to which clinical pharmacy services are likely to be successful in most hospitals. This study analyzed new relationships and associations between these health outcome variables and clinical pharmacy services and pharmacy staffing. Associations between pharmacy staffing and clinical pharmacy services on length of stay are provided since these data have not been published previously.

Methods

Sources of Data

Data for 14 clinical pharmacy services and pharmacist staffing were obtained from the 1992 National Clinical Pharmacy Services database.[40] Methods of analyzing data are available elsewhere.[40-42] Mortality rate information was obtained from the Health Care Finance Administration (HCFA).[43] Admissions data, occupancy rates, length of stay, and total cost of care for each hospital were obtained from the American Hospital Association's (AHA) abridged guide to healthcare.[44] The National Clinical Pharmacy Services (NCPS) survey instrument was updated from previous surveys and pretested by 25 directors of pharmacy.[41,42] The question-naire was mailed to the director of pharmacy in each acute care, general medical-surgical hospital listed in the AHA database.[44] Study methodology, variables, and demographic results of this study are available elsewhere.[40-42] The NCPS database is the largest hospital and clinical pharmacy database in the U.S. These databases were integrated into one database, and SAS, release 6.12, implemented on a personal computer, was used for all statistical analyses.[45] All data were for inpatients only.
The AHA listed 4822 general medical-surgical hospitals in 1992.[44] Variables from the AHA database were matched for 3444 hospitals (demographic, severity of illness) that constituted hospitals that could be included in these study populations (100%). Hospitals included in these studies had information on 14 clinical pharmacy services and pharmacist staffing from the NCPS database[40]; length of stay, demographic, and severity of illness variables from the AHA database[44]; and HCFA Medicare mortality data.[43] Only general medical-surgical hospitals were used so as to provide more homogeneous information. Mortality rates, costs, and length of stay information for psychiatric, alcohol and drug rehabilitation, or rehabilitation hospitals would not be appropriate since they are substantially different from general medical-surgical hospitals.[44] From 1597 hospitals in the 1992 NCPS database, 3444 in the AHA database, and 4822 from HCFA, 1029 hospitals were matched for mortality data,[8] 934 for drug cost data,[9] 1016 for total cost of care data,[10] and 1024 for length of stay data. These hospitals constituted the study populations.

Variables and Analysis

Centrally delivered clinical pharmacy services used in the analysis were drug use evaluation, in-service education, drug information, poison information, and clinical research. Patient-specific clinical pharmacy services were adverse drug reaction (ADR) monitoring, pharmacokinetic consultations, drug therapy monitoring, drug protocol management, total parenteral nutrition (TPN) team participation, drug counseling, cardiopulmonary resuscitation (CPR) team participation, medical rounds participation, and admission drug histories. We defined clinical pharmacy services specifically to indicate active participation by the pharmacist in patient care. Definitions for these clinical pharmacy services are shown in Appendix 1.
Hospital pharmacist staffing data were taken from full-time equivalent (FTE) data collected in the NCPS database survey.[40] Hospital pharmacy administrators were defined as FTE pharmacy directors, assistant directors, and supervisory pharmacists; dispensing pharmacists as FTE pharmacists who spent most of their work time (> 50%) primarily in dispensing activities; and clinical pharmacists as FTE pharmacists who spent most of their work time (> 50%) providing clinical pharmacy services (nondispensing). Each category was mutually exclusive. Staffing data were for inpatients only.
Severity of illness was controlled by forcing three variables into the multiple regression analysis model: percentage of intensive care unit (ICU) days (calculated as ICU days divided by total inpatient days), annual number of emergency room visits divided by the average daily census, and percentage of Medicaid patients (calculated as Medicaid discharges divided by total discharges). These variables were validated as severity of illness measures in similar studies.[1,3,4,6-10,46,47] They were chosen because they are the only ones validated as adjusters for severity of illness using these national databases.[1,3,4,6-10,46,47] Other variables have been used to adjust for severity of illness with smaller patient populations (Acute Physiology and Chronic Health Evaluation [APACHE] scores, specific patient case mix, patient age, number of surgical patients, physician experience, length of shifts, patient work loads, etc.), but they were not available for the study hospitals. Diagnosis-related groups are not reliable severity of illness adjusters since many hospitals have inflated these measures.
Patient care outcome measures must adjust for patient characteristics that influence the outcome measure.[48-50] If outcome measures (e.g., length of stay) do not adjust for severity of illness, conclusions for hospitals that treat severely ill patients would be inaccurate, leading to erroneous conclusions about the health care provided by professionals in these institutions.

Statistical Analyses

Severity of illness-adjusted multiple regression analysis was used. All multiple regression models (previous work,[6-10] length of stay, interrelationships among mortality rates, drug costs, total cost of care, length of stay, hospital pharmacy staffing) used the severity of illness-adjusted model. For multiple regression analysis, stepwise procedures were used to select variables for the model.[51,52]
Severity of illness variables were forced into the multiple regression model before any other variables were allowed to enter. A weighted least squares regression was used to estimate and test relationships among hospital and pharmacy staffing, clinical pharmacy services, and mortality rates.[7,8] The weight used in the analysis was the inverse of the variance for the observed mortality rate, N/{p * (1 - p)}, where N was the number of Medicare admissions to the hospital and p was HCFA's expected mortality rate for each hospital. Methods used for these mortality models are discussed in depth elsewhere.[6-8]
After forced entry of severity of illness variables, stepwise regression was used to select remaining variables. Variables selected through this method were confirmed by forward- and backward-regression techniques, both of which selected the same set of variables. The correlation matrix for independent variables and variance inflation factor were used to examine possible effects of multicolinearities for the length of stay analysis.[45] These indicated that there were no apparent problems among the set of independent variables.
We used severity of illness multiple regression analysis to determine interrelationships among mortality rates, drug costs, total cost of care, and length of stay. These relationships are reported as slope, R2, and significance. Slope measures the rate of change for the variable and is expressed as either positive (e.g., as drug costs increased, total cost of care increased) or negative (e.g., as drug costs increased, mortality rates decreased). A higher slope indicated that changes in that variable were associated with greater changes in the other variable (e.g., changes in the number of clinical pharmacists/occupied bed were associated with greater changes in mortality rates than other pharmacy variables). In addition, multiple regression analysis allowed us to determine direct relationships and associations between clinical pharmacy services and pharmacist staffing variables and mortality rates, drug costs, total cost of care, and length of stay in U.S. hospitals.
A comparison of clinical pharmacy services and pharmacy staffing variables that was statistically significant in the multiple regression model for length of stay was developed further. The difference in the length of stay, based on whether the hospital provided the clinical pharmacy service, was determined. Each pharmacy staffing variable was analyzed in a separate multiple regression model that included mortality rates and the severity of illness variables. The a priori level of significance for all tests was set at 0.05.

Results

Length of Stay

A total of 1024 hospitals (64%) of the 1597 general medical-surgical hospitals from the 1992 NCPS database were matched from the 3444 hospitals from the AHA database (potential pool of study hospitals) for length of stay data. These 1024 hospitals constituted the study population. The mean length of stay for each patient admission was 7.12 ± 14.02 days, 55,586 ± 52,190 patient-days/hospital/year, and 57,198,012 patient-days/year for all study hospitals/year (41% of total patient-days for all U.S. hospitals).[53] The mean total cost/patient-day was $933 ± $428. The mean number of admissions/year was 8061.39 ± 6721.89 admissions/hospital or 8,254,883[36] total admissions (34% of all admissions). The average daily census (ADC) for study hospitals was 152.32 ± 143.28 patients/day. Study populations (pool of all U.S. hospitals available for analysis from HCFA and AHA)[43,44] for this and our previous studies represent 3763 hospitals for hospital staffing and mortality rates (78% of all hospitals)[7]; 1029 hospitals for clinical pharmacy services and mortality rates (31% of all hospitals)[8]; 934 hospitals for clinical pharmacy services and drug costs (25% of all hospitals)[9]; 1016 hospitals for clinical pharmacy services, staffing, and total cost of care (30% of all hospitals)[10]; and 1024 hospitals for length of stay (30% of all hospitals).
Table 1 shows associations among mortality rates, drug costs, and total cost of care, length of stay, and clinical pharmacy services and hospital staffing. Two services were associated with reduced length of stay: drug protocol management and pharmacist participation on medical rounds. The number of clinical pharmacists/occupied bed tended to have the greatest association (slope) with reductions in length of stay. The R2 for the length of stay regression model was 11.4% and the adjusted R2 was 10.8%. Table 2 presents information on clinical pharmacy services: deaths/hospital and for all hospitals offering the service,[8] drug cost reductions/hospital and for all hospitals offering the service,[9] and total cost of care increases or decreases for each hospital and all hospitals offering the service.[10] Table 3 shows reductions in length of stay for hospitals that have pharmacist-provided drug protocol management and pharmacist participation on medical rounds (from the length of stay multiple regression model). Figure 1 shows the relationship between mean length of stay/hospital and staffing level of clinical pharmacists (graphed as quintiles: tenth, thirtieth, fiftieth, seventieth, and ninetieth percentiles).

art

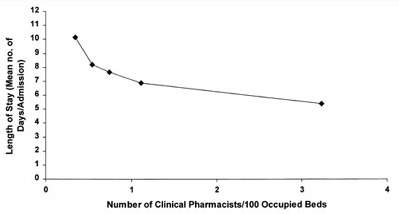
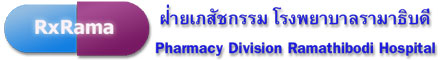
Figure 1. Clinical pharmacist staffing and length of hospital stay.

Interrelationships among Health Care Outcome Variables

As drug costs/occupied bed increased, severity of illness-adjusted mortality rates decreased (slope -38609852, actual R2 8.2%, adjusted R2 7.6%, p<0.0001). This relationship is shown graphically in Figure 2 as death rate/1000 admissions and drug costs/occupied bed/year (quintiles). As the total cost of care/occupied bed increased, severity of illness-adjusted mortality rate decreased (slope -5846720642, actual R2 14.9%, adjusted R2 14.1%, p<0.0001; Figure 3). As drug costs/occupied bed increased, the total cost of care increased (slope 18.989, actual R2 11.5%, adjusted R2 10.7%, p<0.0001). These were the only statistically significant associations among severity of illness-adjusted mortality rates, drug costs, total cost of care, and length of stay.

art

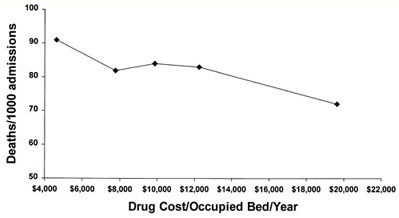
Figure 2. Hospital deaths/1000 admissions and drug costs.
art

Figure 3. Hospital deaths/1000 admissions and total cost of care.

Clinical Pharmacy Services, Hospital Pharmacy Staffing, and Mortality Rate, Drug Costs, and Total Cost of Care

Figure 4 (quintiles), taken from published data but not graphed,[8] shows the relationship between number of pharmacists/100 occupied beds and number of deaths/hospital. The difference between the highest number of deaths/hospital (thirtieth percentile) and lowest number of deaths/hospital (ninetieth percentile) was 264 deaths, a 36% reduction from the 729 deaths/ hospital in the thirtieth percentile. Table 4 presents severity of illness-adjusted multiple regression data for hospital pharmacy staffing categories. As the number of pharmacy adminis-trators increased, mortality rates increased. As the number of dispensing pharmacists, clinical pharmacists, and technicians increased, mortality rates decreased. The number of clinical pharmacists/occupied bed tended to have the greatest association (slope) with reductions in mortality rates (Figure 5).

art

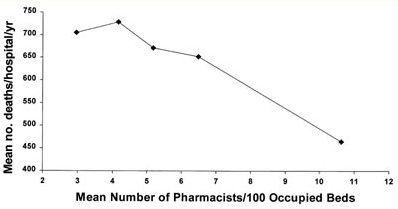
Figure 4. Pharmacist staffing and deaths/hospital.
art

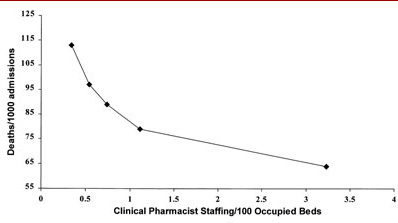
Figure 5. Clinical pharmacist staffing and hospital deaths/1000 admissions.
The only pharmacy variable that was associated with positive outcomes with all four outcome measures was the number of clinical pharmacists/occupied bed. This tended to have the greatest association (slope) with reductions in mortality rate, drug costs, and length of stay. It also had the second highest association (slope) with reductions in total cost of care. No individual clinical pharmacy service was associated with all four outcome measures. Three services were associated with three outcome measures: pharmacist-provided drug information, drug protocol management, and admission drug histories. Pharmacist participation on medical rounds was associated with improvements with two outcome measures, total cost of care and length of stay. Five services were associated with improvements with one outcome measure: drug use review, in-service education, clinical research, ADR monitoring, and CPR team participation. Pharmacist-provided drug information, drug protocol management, and admission drug histories were associated with reductions in both drug costs and total cost of care. Pharmacist-provided clinical research and participation on the TPN team were associated with increased total cost of care.

Discussion

Length of Stay

Reasons why pharmacist-provided drug protocol management was associated with shorter length of stay are unknown. Perhaps the service provides quality control for therapy. Ensuring the quality of drug therapy may increase the efficiency and quality of patient care, which can be measured as shorter length of stay. Length of stay is a strong predicator of hospitals' quality and efficiency of care.[54,55] Inappropriate drug prescribing is associated with increased length of stay.[23,24] There were 432.76 fewer patient-days/hospital associated with the presence of pharmacist-provided drug protocol management, a decrease of 152,998.80 patient-days for the 354 hospitals having this service. A potential reduction of 442,572.80 patient-days (1% of total patient-days for all 1024 hospitals) could be realized if all 1024 hospitals had this service. The median pharmacist salary cost/hospital/year for providing drug protocol management was $1650, or $3.81 of pharmacist salary cost/patient-day saved.[56] Every dollar of pharmacist salary cost was associated with a reduction of $244.88 in length of stay savings ($933 cost/day divided by $3.81), or a 1:244.88 ratio. This service was associated with substantial reductions in cost of care and probable increased profitability for hospitals having pharmacists perform drug protocol management. The service was probably an indicator of hospitals' efficiency and quality of care.
Reasons why pharmacists' participation on medical rounds was associated with shorter length of stay also are unknown. Since medical rounds are where most decisions are made about patient care, perhaps pharmacists influence drug therapy decisions and reduce risks of adverse drug events. Other investigators also found this result associated with placing clinical pharmacists on rounds in individual hospitals.[26,27,57-59] Our data clearly confirm the finding. There were 164.82 fewer patient-days/hospital associated with the presence of pharmacist participation on medical rounds, a decrease of 25,178.46 patient-days in the 153 hospitals having the service. A potential reduction of 168,514.65 patient-days (0.3% of the total patient-days for all 1024 hospitals) could be realized if all 1024 hospitals had this service. The median pharmacist salary cost/hospital for pharmacists attending medical rounds was $31,652/year, or $192.04 of pharmacist salary cost/patient-day saved.[56] Every dollar of pharmacist salary cost was associated with a reduction of $4.86 in length of stay savings ($933 cost/day divided by $192.04), or a 1:4.86 ratio. This service was associated with substantial reductions in cost of care and probable increased profitability for hospitals having pharmacists on medical rounds. It is probably an indicator of hospitals' efficiency and quality of care.
As clinical pharmacist staffing increased from the tenth percentile (0.34/100 occupied beds) to the ninetieth percentile (3.23/100 occupied beds), mean length of stay fell from 10.17 to 5.39 days/patient, a difference of 4.78 days/patient or a 47% reduction. The number of clinical pharmacists/occupied bed tended to have the greatest association (slope) with reductions in length of stay. It was the best predictor of all pharmacy variables for shorter length of stay in study hospitals.

Interrelationships between Health Care Outcome Measures

The relationship between the severity of illness-adjusted death rate/admission and drug costs/occupied bed (slope -38609852, R2 8.2%, p<0.0001) is rather striking. As drug costs increased from the tenth ($4623) to the ninetieth percentile ($19,628)/occupied bed/year, the death rate declined from 91/1000 to 72/1000 admissions, a 21% decline. With 8061.39 ± 6721.89 admissions/hospital/year, this translates into a difference of 153 deaths/hospital having drug spending between the tenth and ninetieth percentiles. This translates into a reduction of 0.42 deaths/day/hospital between these drug cost levels. If these differences in deaths were extrapolated to all study hospitals, the number of lives saved associated with increased drug costs could be substantial. The drug cost/death difference between hospitals spending at the tenth and ninetieth percentiles was $14,938/ death ($15,005 difference in drug costs/occupied bed/year {tenth-ninetieth percentiles} divided by 153 deaths x 152.32 {ADC}). Since mortality rates are a very good indicator of the quality of care,[3,4,42,48,49] it appears that higher drug costs predict better patient care.
Reasons for findings between drug costs and mortality rates are not known. The relationship between higher drug costs and lower mortality rates suggests that newer more costly drugs may be better than older less expensive ones in reducing deaths. This is not to suggest that indiscriminate use of drugs is appropriate, but health care outcomes must be considered and measured when cost cutting is pursued. This finding suggests that restricting or rationing drugs based on cost alone may be detrimental to patient care. These data clearly indicate that costs and outcomes are associated in a manner that is somewhat unexpected. In the future, pharmacists must focus not only on costs, but also on health care outcome measures. Otherwise, in an effort to reduce costs, we may adversely affect an important health outcome and harm patients.
The relationship between the severity of illness-adjusted death rate/admission and total cost of care/occupied bed (slope -5846720642, R2 14.9%, p<0.0001) is impressive. As total costs increased from the tenth ($287,205) to the ninetieth percentile ($495,305)/occupied bed/year, the death rate declined from 105/1000 to 68/1000 admissions (35% decline). With 8061.39 ± 6721.89 admissions/hospital/year, this translates into a difference of 298 deaths/hospital having total spending between the tenth and ninetieth percentiles. This translates into a reduction of 0.82 deaths/day/hospital between these total cost of care levels. If these differences in deaths were extrapolated to all study hospitals, the number of lives saved associated with increased total cost of care could be substantial. The total cost/death difference between hospitals spending at the tenth and ninetieth percentiles was $106,368/death ($208,100 difference in total costs/occupied bed/year {tenth-ninetieth percentile} divided by 298 deaths x 152.32 {ADC}). Since mortality rates are a very good indicator of quality of care,[3,4,42,48,49] it appears that higher hospital costs predict better patient care. This suggests that indiscriminate cost cutting in the hospital (staff or supplies) may be deleterious to patient care.
Reasons for findings between total cost of care and mortality rates are unknown. This relationship is not unexpected, since the largest component of a hospital's cost structure is personnel, and increased staffing levels of medical residents, registered nurses, pharmacists, medical technologists, and total hospital personnel are associated with lower mortality rates.[7] The relationship between drug costs and total cost of care (slope 18.99, R2 11.5%, p<0.0001) seems logical, since drug costs are a component of total hospital costs.

Clinical Pharmacy Services, Hospital Pharmacy Staffing, and Mortality Rates, Drug Costs, and Total Cost of Care

Discussion regarding mortality rates, drug costs, total cost of care, and clinical pharmacy services and hospital pharmacy staffing variables are available elsewhere.[7-10] Relationships between the severity of illness-adjusted death rate/admission and clinical pharmacist staffing/occupied bed (slope -0.408114, R2 10.1%, p<0.0001) are striking. As clinical pharmacist staffing levels increased from the tenth (0.34/100 occupied beds) to the ninetieth percentile (3.23/100 occupied beds), hospital deaths declined from 113/1000 to 64/1000 admissions (43% decline). With 8061.39 ± 6721.89 admissions/hospital/year, this translates into a difference of 395 deaths/hospital having clinical pharmacist staffing between the tenth and ninetieth percentiles. This translates into a reduction of 1.09 deaths/day/hospital between these staffing levels. If these differences in deaths were extrapolated to all study hospitals, the number of lives saved associated with increased clinical pharmacist staffing could be substantial. The clinical pharmacist staffing/100 occupied beds/death difference between hospitals staffing clinical pharmacists at the tenth and ninetieth percentiles was 0.0073 FTE clinical pharmacist/death (2.89 FTE clinical pharmacist {tenth-ninetieth percentile} divided by 395 deaths). The 1992 mean pharmacist salary for hospital pharmacists was $43,791 ± 12,206.[56] The total pharmacist salary cost/death difference between hospitals having clinical pharmacist staffing at the tenth and ninetieth percentiles was $320 ($43,791 ± 12,206 x 0.0073). Since mortality rates are a very good indicator of quality of care,[3,4,42,48,49] it appears that higher staffing levels of clinical pharmacists predict better patient care.
One of the more disturbing aspects of associations between hospital pharmacy staffing and severity of illness-adjusted mortality rates is the increased death rate associated with increased staffing of hospital pharmacy administrators. This is consistent with what we reported previously with hospital administrators.[7] Given the administrative inefficiency of our health care system,[60] high hospital administrative costs (accounting for 26% of total hospital costs),[61] and this association with mortality rates, it may be prudent to limit the number of hospital pharmacy administrative personnel. In addition, further study seems warranted to determine specific reasons why increased staffing levels of hospital administrators and hospital pharmacy administrators are associated with increased mortality.
With the exception of clinical pharmacists, staffing levels of pharmacy administrators, dispensing pharmacists, and pharmacy technicians have both positive and negative associations with health care outcome measures. Increased hospital pharmacy administrative staffing was associated with increased mortality rates and increased drug costs, but decreased total cost of care. Increased dispensing pharmacist staffing was associated with reduced mortality rates, but increased drug costs and increased total cost of care. Increased pharmacy technician staffing was associated with decreased mortality rates, but increased drug costs. In contrast, increased clinical pharmacist staffing was uniformly associated with reduced mortality rates, decreased drug costs, decreased total cost of care, and shorter length of stay. If we are to effect major health care outcome measures and reduce costs, it appears that we should significantly increase clinical pharmacist staffing and reduce pharmacy administrator and dispensing pharmacist staffing. This recommendation takes on added importance considering that only 11% of pharmacy staffing in 1992 was allocated to clinical pharmacists.[62] We believe the results of our previous studies[7-10] and this study are conclusive with respect to hospital pharmacy staffing. The path is clear, and the profession should not continue to spend most of its personnel resources on the distribution system and administrative personnel. A paradigm shift must occur in organized pharmacy if we are to improve health care outcomes and maximize our ability to reduce health care costs.
The beneficial results of clinical pharmacists and clinical pharmacy services are unequivocal given the data presented. These findings are remarkable since they were evident about 25 years after the first clinical pharmacists began to appear in the nation's hospitals. It is clear that clinical pharmacists are associated with improvements in the study's four outcome measures. It is less clear what specific clinical pharmacy services conclusively produce benefits with all of these health care outcomes. This is not surprising, since clinical pharmacists have been practicing only for a little over 3 decades. Clinical pharmacy is now in a phase where services are still being solidified. Standard practice methodology is not fully accepted or available in many hospitals. It may take another generation before specific clinical pharmacy services are common expectations of care in the nation's hospitals. Although the journey is not completed, we are well along the road to improving patient care. The results of our five studies unequivocally show that pharmacists, by providing clinical pharmacy services, have a bright future in health care. To make optimum contributions, we must leave the dispensing and administrative modes and provide direct patient care. It is our hope that pharmacists use these data to complete the work that the first clinical pharmacists began in the 1960s and 1970s.

Specific Recommendations

Hospital Pharmacy Staffing. Data from our five studies unequivocally show that the best way for the profession to improve patient care and reduce costs is to increase staffing levels of clinical pharmacists. Given the mixed results with hospital pharmacy administrators and dispensing pharmacists, staffing levels for these types of pharmacists should be decreased. Priority should be given to reducing pharmacists' dispensing and administrative time and increasing the level of clinical services provided to patients.
Clinical Pharmacy Services. Strong consideration should be given to having drug histories, drug information, and drug protocol management services as part of core clinical pharmacy services for most hospitals. These services were associated with positive outcomes with three of the four health care outcome measures. Including medical rounds into the service core mix may be considered since this service was associated with improvements with two health care outcome measures. No clear picture emerges on the remaining clinical pharmacy services. However, regardless of services provided, staffing of clinical pharmacists was the best indicator of improved patient care outcomes and reduced costs. Given staffing levels for pharmacy in U.S. hospitals, it is likely that specific populations of patients must be identified to receive clinical pharmacy services.[62]

Cost Savings. Given the relationship between drug costs, total cost of care, and mortality rates, it seems prudent to suggest that cost-cutting initiatives should include appropriate health care outcome variables (mortality rates, length of stays, etc.). If we do not include these measures when implementing initiatives, we ultimately may decrease the quality of care and harm patients. Any measures that cut costs should have an appropriate monitoring period that includes assessment of both costs and patient care outcomes. These results clearly show that reduced drug costs and reduced total cost of care can affect patients in a negative way. We must remember that the guiding principle of patient care is first to do no harm.

Limitations

Mortality rates, drug costs, total cost of care, and length of stay information is from 1992 and does not reflect the current year. Annual inflation rates and annual drug cost inflation rates of 20% would have to be considered to interpret these dollar figures in terms of current costs.[62] Similarly, the data do not reflect changes that have occurred in the health care delivery and reimbursement system since 1992. It is possible that information provided to the AHA by hospitals and provided to us for the NCPS database were inaccurate. We did not attempt to verify the information. The total variance explained by our five regression models was consistent with other studies.[2-4,50,63,64] Since these studies were among the first to compare clinical pharmacy services, pharmacist staffing, and major health care outcome measures in a large number of U.S. hospitals, the findings have to be replicated in future studies. It is possible that the hospitals in our study population were not representative of all U.S. hospitals. However, this is doubtful because they represent 25-78% of all hospitals[7-10] available from HCFA and the AHA for possible study.[43,44] This study design allowed us to determine direct relationships between variables, but it did not allow us to determine causality. We were able to obtain only information about clinical pharmacy services. Information about services of other health care professionals, hospital structure, process, or other variables that could affect these outcome measures could not be obtained or evaluated. If these data were available, it is possible that they could affect our findings. Therefore, these findings should not be construed as cause and effect. Caution should be employed in applying our findings to individual hospitals.

Summary

These five studies clearly support the role of clinical pharmacists and clinical pharmacy services in caring for patients in the nation's hospitals. Increased staffing levels of clinical pharmacists were associated with improvements in all four heath care outcome measures. The number of clinical pharmacists/occupied bed tended to have the greatest association with reductions in mortality rate, drug costs, and length of stay. Given positive and negative findings with hospital pharmacy administrator and dispensing pharmacist staffing and outcome measures, it appears that the best way to improve patient care and reduce costs is to increase staffing levels of clinical pharmacists and promote clinical pharmacy services that these pharmacists perform. Seventeen clinical pharmacy services were associated with improvements in mortality rates, drug costs, total cost of care, and length of stay in U.S. hospitals. It is our hope that pharmacists use the results of these five studies to continue the development of clinical pharmacy. We must establish a common set of services to provide to patients.

Table 1. Summary of Significant Associations Among Clinical Pharmacy Services, Pharmacy Staffing, and Mortality Rates, Drug Costs, Total Cost of Care, and Length of Stay

  Mortality Rate[8]
(1029 hospitals)
Drug Costs[9]
(934 hospitals)
Total Cost of Care[10]
(1016 hospitals)
Length of Stay
(1024 hospitals)
  Slope p Value Slope p Value Slope p Value Slope p Value
Central clinical pharmacy services
   Drug-use evaluation


-34871
0.001
 
 
   In-service education
 
 
-1148
0.016


   Drug information
-0.002
0.043
-1090
0.015
-11749402
0.003
 
 
   Poison information


   Clinical research
-0.008
0.0001
 
 
42922279
0.0001
 
 
Patient-specific clinical pharmacy services
   ADR monitoring


-6599253
0.008
 
 
   Pharmacokinetic consultations


   Drug therapy monitoring


   Drug protocol management
 
 
-1065
0.049
-17423551
0.001
-1.30
0.008
   TPN team participation


10789291
0.001
 
 
   Drug counseling


   CPR team participation
-0.002
0.039


   Medical rounds participation


-4770426
0.0001
-1.71
0.001
   Admission drug histories
-0.006
0.005
-1450
0.011
-6106570
0.017
 
 
Pharmacy staffing/occupied beds
   All pharmacists
-0.0381
0.0185


   Pharmacy administrators
Xa
Xa
46442
0.0001
-324890768
0.0001
 
 
   Dispensing pharmacists
Xa
Xa
53299
0.0001
120000000
0.006
 
 
   Clinical pharmacists
Xa
Xa
-21809
0.018
-38864012
0.007
-26.59
0.001
   Pharmacy technicians
Xa
Xa
54915
0.0001


R2 (actual) 22.4% 15.3% 48.9% 11.4%
aNot determined as part of the original analysis. See Table 4 for specific information on pharmacy staffing and mortality rates.

Table 2. Summary of Significant Associations Between Clinical Pharmacy Services and Lower Number of Deaths, Drug Costs, and Total Cost of Care

  Lower Deaths (actual)[8]
(1029 hospitals)
Lower Drug Costs ($)[9]
(934 hospitals)
Total Cost of Care ($)
(increase or reduction)[10]
(1016 hospitals)

  Per Hospital All Hospitalsa Per Hospital All Hospitalsa Per Hospital All Hospitalsa
Central clinical pharmacy services
   Drug use evaluation


1,119,810
1,005,589,542
   In-service education
 
 
77,879
48,518,735
 
 
   Drug information
3.89
10,463
430,580
90,852,346
5,226,128
1,212,461,747
   Poison information


   Clinical research
11.63
21,125
 
 
(9,558,788)b
(1,013,231,529)b
Patient-specific clinical pharmacy services
   ADR monitoring


1,610,841
1,101,815,258
   Pharmacokinetic consultations


   Drug therapy monitoring


   Drug protocol management
 
 
137,334
45,045,444
1,729,608
614,010,986
   TPN team participation


(3,211,355)b
(1,027,633,638)b
   Drug counseling


   CPR team participation
2.1
5047


   Medical rounds participation


7,979,721
1,212,917,508
   Admission drug histories
8.61
3843
213,388
5,548,094
6,964,145
208,924,355
aAll hospitals that offer the service.
bIncrease in total costs associated with these services.

Table 3. Length of Stay for Hospitals with Clinical Pharmacy Services Associated with Significantly Shorter Length of Stay in the Multiple Regression Model

Services Associated with
Reduced Length of Stay
No. (%) of
Hospitals Providing
the Service
Mean Reduction in
Length of Stay/Patient
in Hospitals
Offering the Service
Total No. of
Patient Days
Reduced/Hospital
Offering the Service
Total No. of
Patient Days Reduced
for All Hospitals
Offering the Service
Drug protocol management
354 (34.6)
1.22 ± 0.91
432.67 ± 167.93
152,998.80
Medical rounds participation
153 (14.8)
1.34 ± 0.93
164.82 ± 88.51
25,178.46

Table 4. Relationships between Hospital Pharmacy Staffing and Severity of Illness-Adjusted Mortality Rates

  R2
 
Types of Hospital Pharmacy Staff Slope Actual (%) Adjusted (%) Significance
All pharmacists
-0.101710
4.5
4.1
0.0001
   Pharmacy administrators
0.190177
3.4
3.2
0.0001
   Dispensing pharmacists
-0.091700
3.6
3.3
0.0001
   Clinical pharmacists
-0.408114
10.1
9.8
0.0001
Pharmacy technicians
-0.097564
3.2
2.8
0.0001

Appendix 1. Definitions of Clinical Pharmacy Services

Central Clinical Pharmacy Services

Patient-Specific Clinical Pharmacy Services

References

  1. Kuhn EM, Hartz AJ, Gottlieb MS, Rimm AA. The relationship of hospital characteristics and results of peer review in six large hospitals. Med Care 1991;29:1028-38.
  2. Green J, Passman LJ, Wintfield N. Analyzing hospital mortality -- the consequences of diversity in patient mix. JAMA 1991;265:1849-53.
  3. Hartz AJ, Gottlieb M, Kuhn EM, Rimm A. A national validation study of Medicare mortality studies (project #1247-M). Technical report to the Health Standards Review Bureau. Washington, DC: U.S. Government Printing Office, 1989.
  4. Hartz AJ, Krakauer H, Kuhn EM, et al. Hospital characteristics and mortality rates. N Engl J Med 1989;321:1720-5.
  5. Kelly JV, Hellinger FJ. Physician and hospital factors associated with mortality in surgical patients. Med Care 1986;24:785-800.
  6. Pitterle ME, Bond CA, Raehl CL, Franke T. Hospital and pharmacy characteristics associated with mortality rates in United States hospitals. Pharmacotherapy 1994;14(5):620-30.
  7. Bond CA, Raehl CL, Pitterle ME, Franke T. Health care professional staffing, hospital characteristics, and hospital mortality rates. Pharmacotherapy 1999;19(2):130-8.
  8. Bond CA, Raehl CL, Franke T. Clinical pharmacy services and hospital mortality rates. Pharmacotherapy 1999;19(5):767-81.
  9. Bond CA, Raehl CL, Franke T. Clinical pharmacy services, pharmacist staffing, and drug costs in United States hospitals. Pharmacotherapy 1999;19(12)1354-62.
  10. Bond CA, Raehl CL, Franke T. Clinical pharmacy services, pharmacy staffing, and the total cost of care in United States hospitals. Pharmacotherapy 2000;20(6);609-21.
  11. Black BL. Resource book on progressive pharmaceutical services. Bethesda, MD: American Society of Hospital Pharmacists, 1986.
  12. Hatoum HT, Catizone C, Hutchinson RA, et al. An eleven-year review of the pharmacy literature: documentation of the value and acceptance of clinical pharmacy. Drug Intell Clin Pharm 1986;20:33-48.
  13. Comptroller General of the United States. Study of health facilities construction costs. Washington, DC: U.S. Government Printing Office, 1972:68-72, 363-79.
  14. Barker KN, Pearson RE. Medication distribution systems. In: Brown TR, Smith, MC, eds. Handbook of institutional pharmacy practice. Baltimore: Williams & Wilkins, 1986:325-51.
  15. Elenbaas RM, Payne VW, Bauman JL. Influence of clinical pharmacists consultations on the use of blood level test. Am J Hosp Pharm 1980;37:61-4.
  16. Bollish SJ, Kelly WN, Miller DE, et al. Establishing an aminoglycoside pharmacokinetic monitoring service in a community hospital. Am J Hosp Pharm 1981;38:73-6.
  17. Abramowitz PA, Nold EC, Hatfield SM. Use of clinical pharmacists to reduce cefamandole, cefoxitin, and ticarcillin costs. Am J Hosp Pharm 1982;39:1176-80.
  18. Mutchie KD, Smith KA, MacKay MW, et al. Pharmacists' monitoring of parenteral nutrition: clinical and cost effectiveness. Am J Hosp Pharm 1979;36:785-7.
  19. Covinsky JO, Hamburger SC, Kelly KL, et al. Impact of docent clinical pharmacists on treatment of streptococcal pneumonia. Drug Intell Clin Pharm 1982;16:587-91.
  20. Bond CA, Salinger RJ. Fluphenazine out-patient clinics: a pharmacist's role. J Clin Psychiatry 1979;40:501-3.
  21. Herfindal ET, Bernstein LR, Kishi DT. Effect of clinical pharmacy services on prescribing on an orthopedic unit. Am J Hosp Pharm 1983;40:1945-51.
  22. Avorn J, Soumerai SB. Improving drug-therapy decisions through educational outreach: a randomized controlled trial of academically based "detailing." N Engl J Med. 1983;308:1457-63.
  23. Knapp DE, Knapp DA, Speedie MK, et al. Relationship of inappropriate drug prescribing to increased length of hospital stay. Am J Hosp Pharm 1979;36:1334-7.
  24. Knapp DE, Speedie MK, Yaeger DM, et al. Drug prescribing and its relationship to length of hospital stay. Inquiry 1980;17:254-9.
  25. McKenney JM, Wasserman AH. Effect of advanced pharmaceutical services on the incidence of adverse drug reactions. Am J Hosp Pharm 1979;36:1691-7.
  26. Clapham CE, Hepler CE, Reinders TP, et al. Economic consequences of two drug-use control systems in a teaching hospital. Am J Hosp Pharm 1988;45:2329-40.
  27. Bjornson DC, Hiner WO, Potyk RP, et al. Effect of pharmacist on health care outcomes in hospitalized patients. Am J Hosp Pharm 1993;50:1875-84.
  28. Jenkins MH, Bond CA. The impact of clinical pharmacists on psychiatric patients. Pharmacotherapy 1996;16(4):708-14.
  29. Monson RA, Bond CA, Schuna A. Role of the clinical pharmacist in improving out-patient drug therapy. Arch Intern Med 1981;141:1441-4.
  30. Bond CA, Monson R. Sustained improvement in drug documentation, compliance, and disease control -- a four year ambulatory care model. Arch Intern Med 1984;144:1159-62.
  31. Tang I, Vrahnos D, Hatoum H, et al. Effectiveness of clinical pharmacist interventions in a hemodialysis unit. Clin Ther 1993;15:459-64.
  32. Brown WJ. Pharmacist participation on a multidisciplinary rehabilitation team. Am J Hosp Pharm 1994;51:91-2.
  33. Garber AM, Fuchs VR, Silverman JF. Case mix, costs, and outcomes between faculty and community services in a university hospital. N Engl J Med 1984;310:1231-7.
  34. Pauly MV, Wilson P. Hospital output forecasts and the cost of empty hospital beds. Health Serv Res 1986;21:413-28.
  35. Rich EC, Gifford G, Luxenberg M, et al. The relationship of hospital staff experiences to the cost and quality of inpatient care. JAMA 1990;263:953-7.
  36. Watts CA, Klastorin TD. The impact of case-mix on hospital costs: a comparative analysis. Inquiry 1990;17:357-67.
  37. Schumock GT, Meek PD, Ploetz PA, Vermeulen LC. Economic evaluation of clinical pharmacy services -- 1988-1995. Pharmacotherapy 1996;16(6):1188-1208.
  38. Gattis WA, Hasselblad V, Whellan DJ, O'Connor CM. Reduction in heart failure events by the addition of a clinical pharmacist to the heart failure team. Arch Intern Med 1999;159:1939-45.
  39. Leape LL, Cullen DJ, Clapp MD, et al. Pharmacist participation on physician rounds and adverse drug events in the intensive care unit. JAMA 1999;282:267-70.
  40. Bond CA, Raehl CL, Pitterle ME. 1992 National clinical pharmacy services study. Pharmacotherapy 1994;14(3): 282-304.
  41. Raehl CL, Bond CA, Pitterle ME. Hospital pharmacy services in the Great Lakes region. Am J Hosp Pharm 1990;47: 1283-1303.
  42. Raehl CL, Bond CA, Pitterle ME. Pharmaceutical services in U.S. hospitals in 1989. Am J Hosp Pharm 1992;49:323-46.
  43. Health Care Financing Administration. Medicare hospital mortality information (on data tape). Washington, DC: Health Care Financing Association, 1992.
  44. American Hospital Association. American Hospital Association abridged guide to the health care field (on diskettes). Chicago, IL: Author, 1992.
  45. SAS Institute Inc. SAS, version 6.12, Cary, NC: Author, 1998.
  46. Keeler EB, Rubenstein LV, Kahn KL, et al. Hospital characteristics and quality of care. JAMA 1992;268:1709-14.
  47. Shortell SM, Hughes EFX. The effect of regulation, competition, and ownership on mortality rates among hospital inpatients. N Engl J Med 1988;318:1100-7.
  48. Dubois RW, Brooks RH, Rodgers WH. Adjusted hospital death rates; a potential screen for quality of medical care. Am J Public Health 1987;77:1162-7.
  49. Krakauer H, Bailey RC, Skellan KJ, Stewart JD, Hartz AJ. Evaluation of the HCFA model for the analysis of mortality following hospitalization. Health Serv Res 1992;27(3):317-35.
  50. Green J, Wintfield N, Sharkey P, Passman LJ. The importance of severity of illness measures in assessing hospital mortality. JAMA 1990;262:241-6.
  51. Wampole BE, Freund RD. Use of multiple regression in counseling psychology research: a flexible data analytic strategy. J Counsel Psychol 1987;34:372-82.
  52. Pedhazur EJ. Multiple regression in behavioral research: explanation and prediction, 2nd ed. New York: Harcourt Brace Jovanovich, 1982.
  53. American Hospital Association. Hospital statistics, 1992, Chicago: Author, 1993.
  54. Anonymous. Use of LOS by professional standards review organizations (PSRO) is an important illustration. Fed Register 1979;44(108):32,081-91.
  55. Goran M. Evolution of the PSRO hospital review system. Med Care 1979;17(5 suppl):1-18.
  56. Bond CA, Raehl CL, Pitterle ME. Cost of pharmaceutical services in U.S. hospitals in 1992. Am J Hosp Pharm 1995;52:503-613.
  57. Mamdani MM, McCreadie RE, Simmerman C, et al. Clinical and economic effectiveness of an inpatient anticoagulation service. Pharmacotherapy 1999;19(9):1064-74.
  58. Boyko WL, Yurkowski JJ, Ivey MF, et al. Pharmacist influence on economic outcomes in a tertiary care teaching hospital. Am J Health-Syst Pharm 1997;54:1591-5.
  59. Haig GM, Kiser LA. Effect of pharmacist participation on a medical team on costs, charges, and length of stay. Am J Hosp Pharm 1991;48:1457-62.
  60. Woolhandler S, Himmelstein DV. The deteriorating administrative efficiency of the United States health care system. N Engl J Med 1991;324:1253-8.
  61. Woolhandler S, Himmelstein DV. Costs of care and administration at for-profit and other hospital in the United States. N Engl J Med 1997;336:769-74.
  62. Bond CA, Raehl CL. Changes in pharmacy, nursing, and total personnel staffing in United States hospitals: 1989-1998. Am J Health-Syst Pharm 2000;57:970-4.
  63. Shortell SM, Hughes EFX. The effect of regulation, competition, and ownership on mortality rates among hospital inpatients. N Engl J Med 1988;318:1100-7.
  64. Daley J, Jencks S, Draper D, et al. Predicting hospital-associated mortality for Medicare patients. JAMA 1988;260:3617-14.


Back To Top © 2001-2009 RxRama ---- All rights reserved.